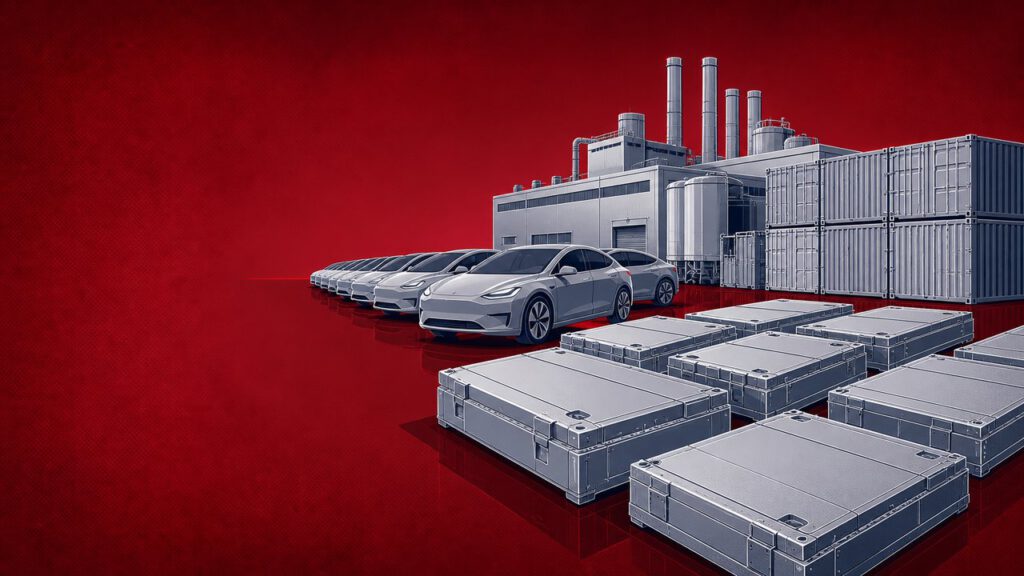

Global battery usage in electric vehicles registered worldwide reached approximately 844.2 GWh from January through August 2026, up 19.7% year over year, according to SNE Research. The calculation covers battery-electric vehicles, plug-in hybrids and conventional hybrids. August usage totaled 116.8 GWh, an increase of 14.3%, below July’s 23.3% growth rate.
Contemporary Amperex Technology Co., Limited (CATL) remained the largest supplier with 333.0 GWh, up 25.2%. Its market share increased 1.7 percentage points to 39.4%. BYD ranked second with 127.9 GWh, up 6.2%, while its share declined 2.0 percentage points to 15.1%. Together, the two suppliers accounted for 54.6% of the market.
LG Energy Solution retained third place with 68.3 GWh, an increase of 0.9%. Its share fell from 9.6% to 8.1% as North American usage declined 42.3% to 14.6 GWh. SK On recorded 24.9 GWh, down 14.5%, after its North American usage fell 41.8% to 6.8 GWh. The combined share of three Korean suppliers decreased 3.9 percentage points to 12.7%.
Other Chinese suppliers recorded stronger growth. CALB reached 44.4 GWh, Gotion 41.5 GWh, EVE 29.5 GWh, SVOLT 22.0 GWh and REPT 20.3 GWh. Including CATL and BYD, the seven Chinese suppliers increased their combined share from 69.7% to 73.3%. SNE Research linked the increase to domestic scale, LFP cost competitiveness and expansion into commercial vehicles, energy storage and overseas automakers.
Regional results diverged during the period. China increased 16.9% to 483.7 GWh, while Europe grew 29.2%, Asia excluding China rose 76.0% and South America increased 179.9%. North America declined 23.7% to 73.1 GWh. The LFP share of the market rose 5.1 percentage points to 57.3%, while average battery capacity per vehicle increased 11.9% to 39.2 kWh.
Global EV Battery Usage Reaches 844.2 GWh Through August
Usage rose 19.7% year-on-year as Chinese suppliers gained share and Korean suppliers lost ground amid widening regional divergence.
Amber flags growth with lost share: CATL and BYD still held 54.6%, close to 54.8% a year earlier.
Source: sneresearch.com